How can you determine the size of your market over the next few years?

Every manager would like to know how large their market will be three or five years from now. In market and competitive intelligence (M&CI), we work with market size forecasting.

At Link Estratégia, we have been developing market forecasts since 2014. The technical term for this approach is system dynamics modeling because the methodology enables us to model and forecast markets, which are dynamic systems. Today, we are building these models using MarketModeler and CorrelationLens within Hub Link Estratégia. In addition to allowing clients to visualize market dynamics, these tools make analysis much easier.

This is important because dynamic systems involve many variables, numerous drivers to consider, and often a lack of comparable data for forecasting.

Building system dynamics diagrams can be highly complex, and while specialized tools help with the calculations, the real challenge lies in selecting the right factors and understanding how they fit into the system. Does a particular flow have a positive or negative impact? Is it a causal relationship or merely a correlation?

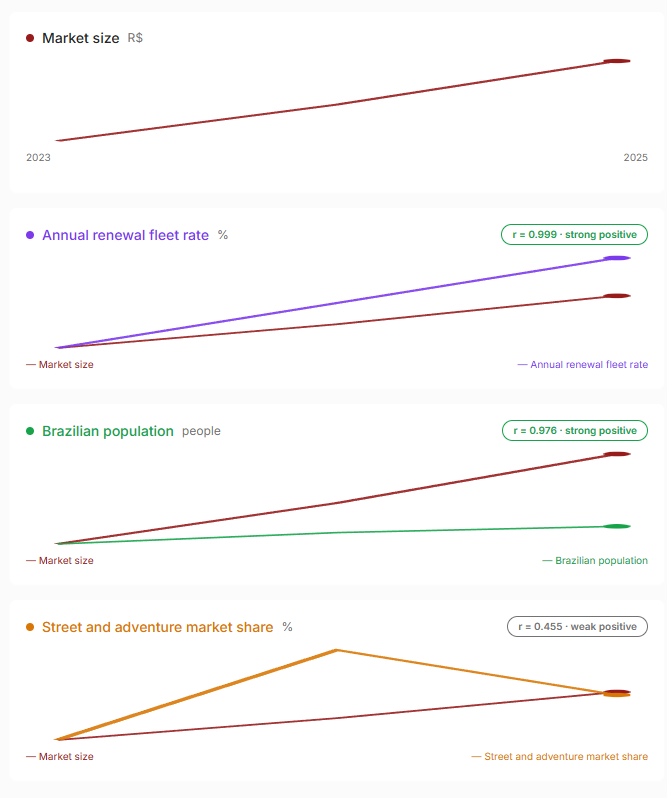
This capability of our intelligence platform allows analysts to select a dependent variable (in the example shown in the image, the size of Brazil’s motorcycle market) and compare it with a wide range of other variables and drivers.

By combining these two Hub capabilities, our analysts can estimate a market’s current size and forecast its future behavior.

Of course, correlation does not imply causation. Determining whether a causal relationship exists is the analyst’s responsibility. However, when the analysis is presented visually, the work becomes easier and more accurate. This enables analysts to define the relationships among variables with greater confidence in a causal loop diagram and deliver more accurate market size forecasts for our clients.
Understanding How Indicator Monitoring Works Within Scenario Analysis

Related Posts

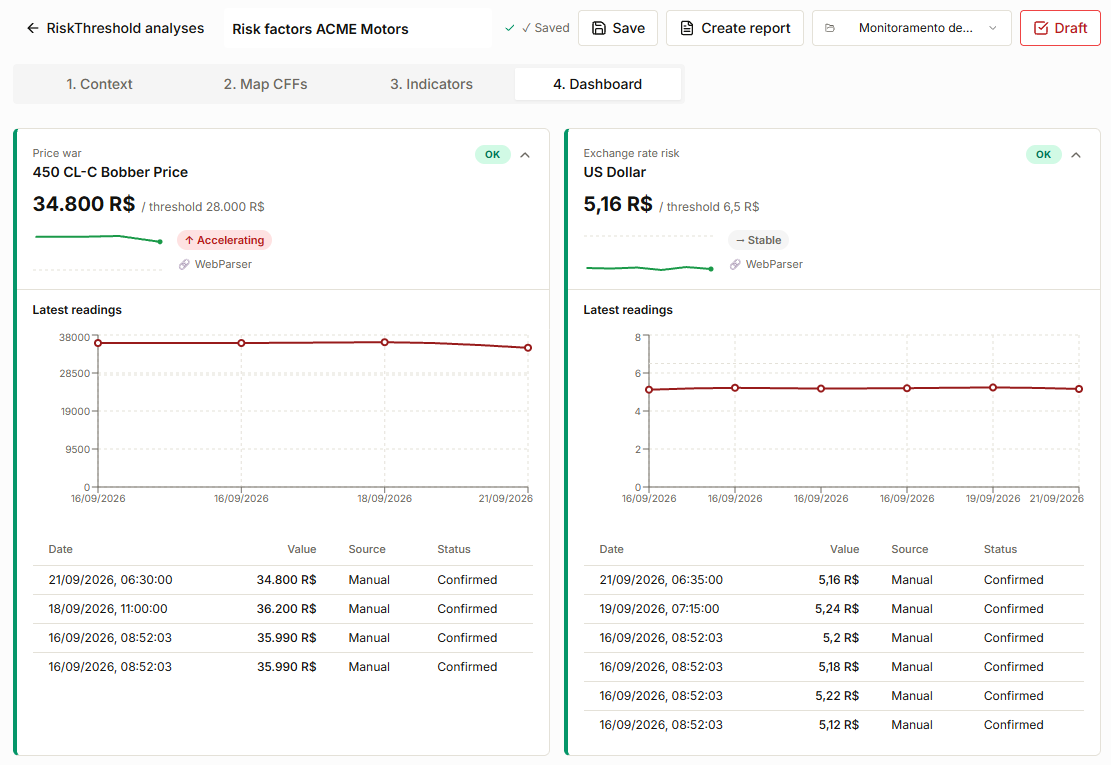
Screenshot showing the use of RiskThreshold. The example displays the monitoring dashboard with ACME Motors’ risk and threat factors. The listed risk factors are foreign exchange risk, with the dollar as the indicator; economic crisis, with monthly IPCA inflation and monthly INPC inflation as indicators; dissatisfaction with the brand or products, with the Reclame Aqui complaint index as the indicator; and price war, with four competitors being monitored. For each factor, the current status or value is shown alongside the defined threshold value. Each factor also displays the monitoring result, indicating whether the risk factor is stable or accelerating and which factors require attention.

30

Sep
All Subjects, Analysis, Market and Competitive Intelligence

New Tool Monitors Risks and Threats to Your Business

Did you know that Link Estratégia has its own methodology for monitoring risks and threats to your business? It is called RiskThreshold and is one of the monitoring modules available on Hub Link Estratégia, our market and competitive intelligence platform. Using RiskThreshold, decision-makers can monitor what we call Critical Failure Factors (CFFs) for the business.

31

Aug
All Subjects, Market and Competitive Intelligence

How to Assess Brand Perception in the B2B Market

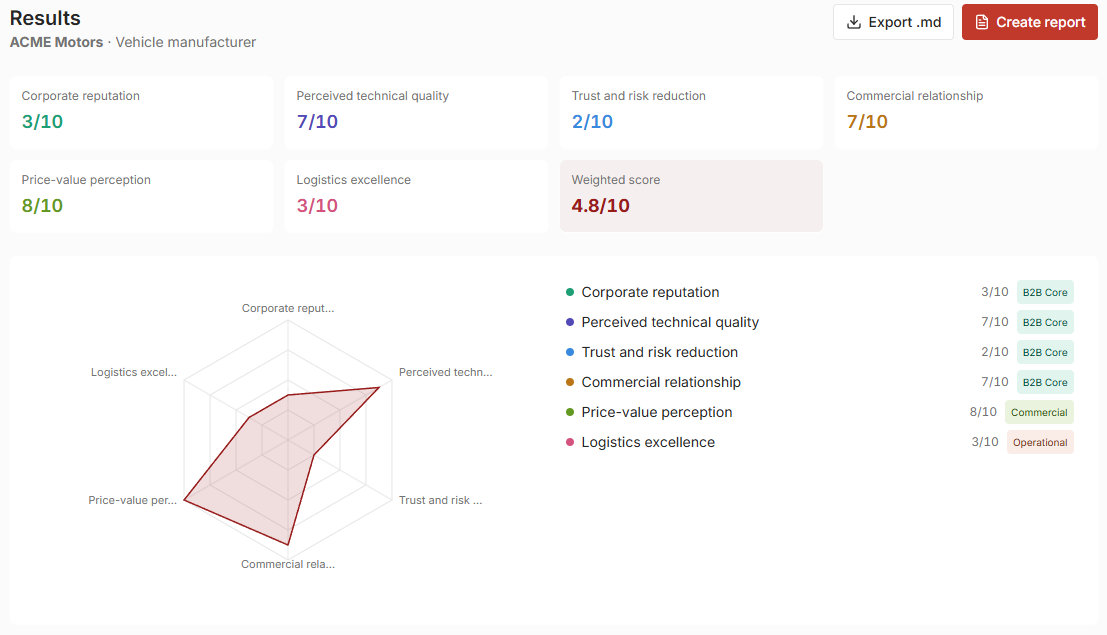
Brand perception in B2B markets does not serve to create superficial emotional appeal, but rather to fulfill a much more pragmatic role: reduce perceived risk in purchasing decisions, sustain long-term commercial relationships, and differentiate the value proposition where price and delivery truly matter.
To structure this diagnosis with methodological rigor, we developed BrandIntel, the brand equity assessment module of Hub Link Estratégia. This module also can be used to assess B2C and B2B2C brands.